Data captures a representation of a real-world system. How well the data represents the real-world system, what parts it’s capturing, and what parts it’s missing, is unknown. However, good data analysis should work around these challenges to discover, and quantify, meaningful patterns, trends, and correlations.
Get to know the context
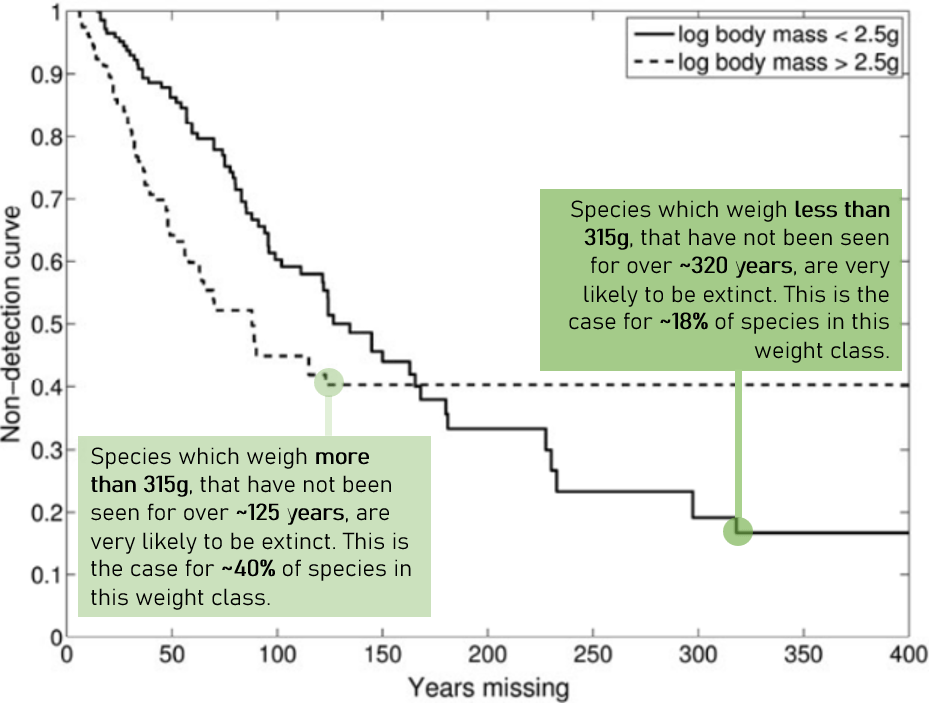
Ideally there is good documentation alongside data sets. If this is missing, then I chat to experts, and/or conduct further research. For example, when I used sighting records of the Ivory Billed Woodpecker to estimate the probability that it is extinct, I learnt that in 2005 the US fish and wildlife service offered a prize for sightings of the Ivory Billed Woodpecker. This explained the boost in observations during this period, yet the observations remained unverified. This helped me generalise our Bayesian model by separating “non-sighting years” into two classes: a year not sighting a species where there was an active search effort, and a year not sighting a species where observations were more reliant on chance enthusiasts.
Get to know the data
Any data analysis starts with looking at the overall patterns. Does the data capture basic, known, relationships? When analysing healthcare data from low to middle income countries, I found that supervision had a stronger impact on health outcomes than training, I was excited because this was news to me! However, when listening in on a call with healthcare experts, I learnt that this was already known. But this spurred me on more! I was doing something right because the analysis was successfully capturing known relationships and confirming expert intuition.
Depending on the topic, and the background of the data analyst, often common sense is enough to check that the data is capturing basic, known, relationships. For example, when analysing domestic electricity use every 30 minutes, knowing that we expect certain daily and weekly patterns is enough. These initial checks may lead to new questions which may direct the analysis. Can we cluster those households that have strong weekday to weekend difference? Or maybe a strong day time to evening difference? Does this correlate with the value or location of the house? And importantly, are these relevant questions for the task at hand?
The magic of machine learning
Sometimes, when trying to find the impactful hidden stories, it’s easy to get distracted by unimportant findings. Especially in our era of big data. Machine learning is undoubtedly a game changing tool. Given the expected classifications of data points, supervised machine learning methods, such as XGBoost and neural networks, can highlight and rank the key variables that led to these classifications astoundingly quick. Nonetheless, I have yet to work with a dataset where impactful insight is gained by throwing an algorithm at it, with all the possible inputs and interactions between these inputs. Even with unsupervised machine learning, such as clustering, where the analyst does not determine the expected classifications, the user must carefully consider which input variables to include. Of course, the analyst experiments. Trial and error remains one of the longest standing methods. But with the huge range of available input variables we now have access to, there remains a need for collaboration between data analysts and experts in the field. Machine learning is not quite ready to replace human knowledge, but it’s an amazing tool to quantify and expand this knowledge.
If you have some data that you wish me look at, please contact me on LinkedIn. I have experience in Bayesian analysis, supervised machine learning, unsupervised machine learning, opinion pooling, optimisation, time-series forecasting, survival analysis and network analysis.